Someone on your team spends an hour improving an AI workflow.
At the end of it, the automation saves six minutes.
From a distance, that can look like a poor trade. We have spent an hour to save six minutes. We are 54 minutes down. Perhaps the person should have stopped tinkering and got on with their actual job.
That reaction is understandable. It is also looking at the wrong bit of the maths.
This is where most AI return-on-investment conversations get stuck. We ask what one automation saved, at one moment, for one person. Then we miss the system that is quietly forming underneath it.
The question is not whether today’s hour saves six minutes today. The question is how often those six minutes come back, how long the improvement survives, and how many people inherit it.
Think of it as a time dividend.
You make the investment once. The saving keeps paying.
The comparison most organisations get wrong
Most work is treated as a one-off transaction.
An hour goes into a report, a customer response or a review. The thing gets finished. The hour is gone.
Compound engineering is different. The hour goes into improving the system that produces the work. That might mean:
- a better instruction;
- a reusable context pack;
- an automated check;
- an evaluation that catches weak outputs;
- a workflow that moves information between tools;
- or a template that stops the same thinking being repeated.
The immediate output is not the point. The next hundred uses are the point.
This is where managers can find the behaviour uncomfortable. They see somebody spending time on the machine rather than processing the next item in the queue.
In the short term, they are right. Delivery slows down.
The useful question is: for how long?
Start with one six-minute saving
Let us keep the first example deliberately small.
You spend one hour improving a workflow. It saves six minutes each time it runs.
If it runs once a day, the original hour is paid back after ten workdays. After 20 workdays, it has returned two hours. After a working year, before allowing for decay, it has returned roughly 25 hours.
That is already a 25-fold gross return on the original hour.
Now change just one assumption.
If the workflow runs five times a day, it returns 30 minutes each day. The original hour is paid back after two workdays.
Nothing magical has happened. The automation has not become more intelligent. It is simply being reused.
Reuse is the economic engine.
What if we invest an hour every day?
A one-off improvement is useful. A regular improvement habit changes the shape of the return.
Imagine giving somebody one hour each day to remove friction from repeatable work. They improve an instruction on Monday. Add a check on Tuesday. Remove a hand-off on Wednesday. Tighten the evaluation on Thursday.
Each improvement is small. Each one starts producing its own time dividend.
At first, the time account is negative. You are still putting more in than you are getting back. Then the earlier improvements begin paying while new ones are being made.
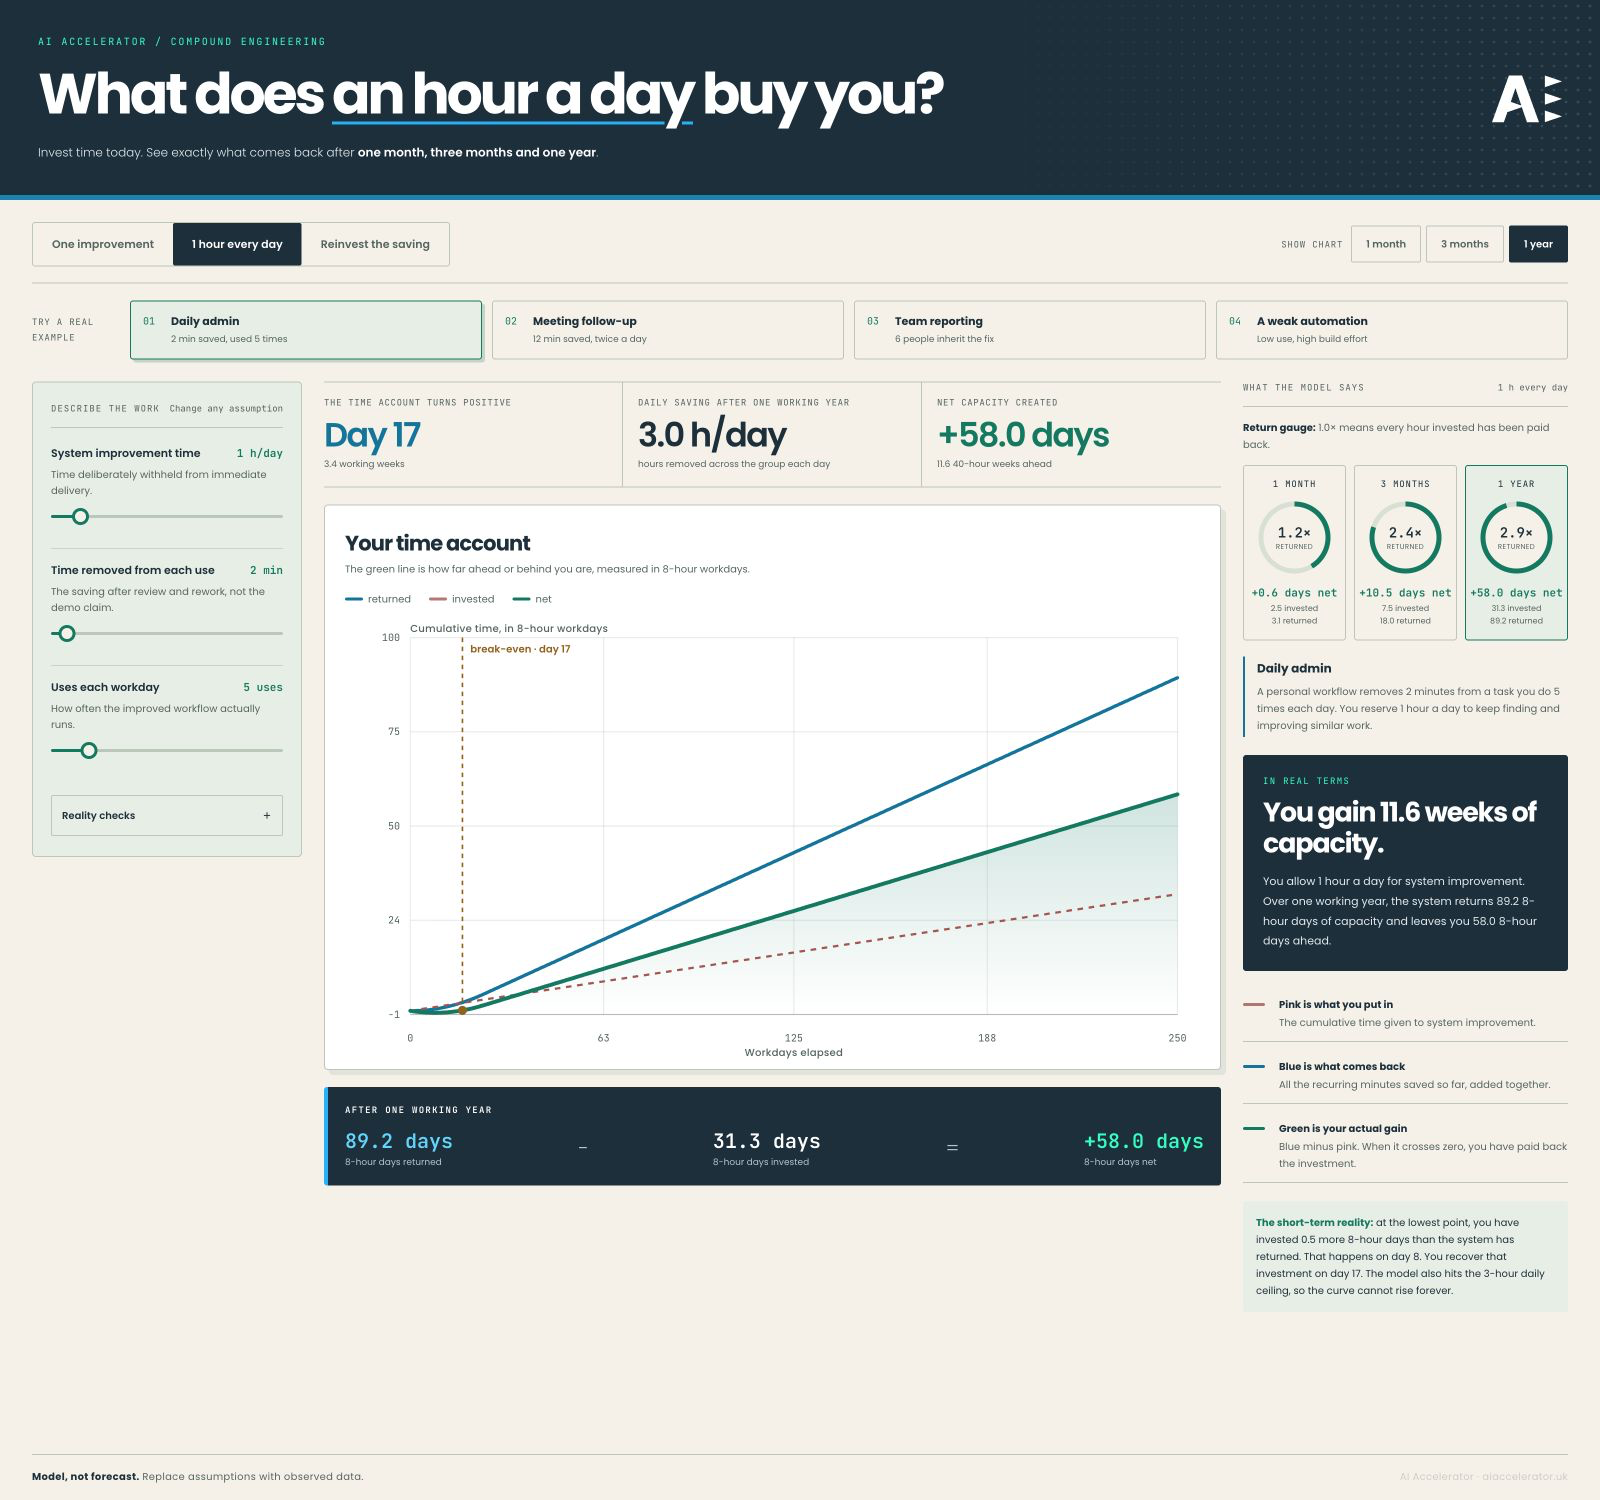
The interactive model below makes that visible.
Open the calculator full screen

Try the three time periods first. The gauges show time returned divided by time invested. A 1.0× return means the investment has paid for itself.
Reading the result in real terms
The default example is intentionally modest.
One person reserves one hour a day for system improvement. Each hour creates a durable improvement that removes a small amount of recurring admin. The model discounts the headline saving for adoption and caps the useful saving at three hours a day.
Here is what the time account says:
| Period | Capacity invested | Capacity returned | Net capacity | Gross return |
|---|---|---|---|---|
| One working month | 2.5 days | 3.1 days | +0.6 days | 1.2× |
| Three working months | 7.5 days | 18.0 days | +10.5 days | 2.4× |
| One working year | 31.3 days | 89.2 days | +58.0 days | 2.9× |
The account turns positive on workday 17.
That is the bit people tend to miss. For a little over three weeks, the programme looks like a cost. After that, the same hour-a-day policy is creating more capacity than it consumes.
By the end of the year, the net gain is 58 eight-hour days of capacity. That is 11.6 working weeks.
It does not mean the calendar suddenly contains 58 extra days. It means the organisation has removed the equivalent of 58 working days from the effort needed to produce the same work.
That capacity still has to be used well. It can go into better service, more throughput, deeper thinking or fewer late evenings. The model does not decide that for you.
The payback date is not the moment you feel it
There is a human bit to this that the graph cannot fully capture.
The model might say the time account turns positive after 17 workdays. That does not mean the team walks into work on day 18 and suddenly feels transformed.
In practice, the compound effect often takes a month or two to become obvious.
During the first few weeks, people are still learning. They are building reusable context, fixing brittle instructions, connecting systems and working out where judgement still belongs. The new way can feel slower because the old way is familiar and the new system is incomplete.
Then the pieces begin to connect.
The context already exists. The workflow knows where to find it. The evaluation catches the familiar mistakes. The correction goes back into the shared instruction. The next piece of work starts from everything the team has already learnt.
That is when the experience changes.
We are starting to see this ourselves. Work that used to take a day can, in the right workflow, take three minutes. Not because one miraculous prompt completes a day’s thinking. It is because the research, structure, context, checks and delivery path have already been engineered into the system.
Once you experience that, it is difficult to go back. The return becomes irresistible because the new starting point is so much further ahead.
This is the tension leaders have to manage. Stop after two weeks and the programme may look like an expensive experiment. Continue for eight weeks and you may be looking at a different operating model.
So yes, you have to hold the faith for a little while. But it should not be blind faith.
Look for leading evidence:
- repeated problems being captured rather than solved again;
- shared components appearing across workflows;
- review and correction time beginning to fall;
- the second improvement taking less effort than the first;
- and people choosing the new workflow without being chased.
Those are the early signs that the engine is forming, even before the full return is visible.
Then the work becomes multiplayer
The economics change again when an improvement is shared.
Consider team reporting. A better workflow saves six minutes, eight times a day, for six people. We assume 70% adoption and six hours of build effort.
The saving is not six minutes.
It is:
6 minutes × 8 uses × 6 people × 70% adoption
That is 201.6 minutes of capacity each workday, or just over 3.3 hours.
Because the build took six hours, each build hour creates 33.6 recurring minutes per workday. In the model, a continuous improvement programme crosses break-even around workday five.
After one working month, it has:
- invested 2.5 eight-hour days;
- returned 12.9 eight-hour days across the team;
- created a net 10.4 days of capacity.
This is why shared workflows matter so much. Multiplayer turns a personal productivity gain into an operating-system gain.
One person writes a better reporting instruction. Six people stop rebuilding the report from scratch. The improvement is captured once and inherited repeatedly.
That is a different category of value from helping one person write one email faster.
The return becomes invisible
There is another reason organisations underestimate the return. By the time it becomes meaningful, it often stops looking like a return.
The first time an AI workflow produces a report in 20 minutes rather than two hours, people notice. Six months later, 20 minutes is simply how long reporting takes.
Nobody raises an invoice for the 100 minutes that disappeared. The team does not put the old friction back into its calendar so finance can see the saving. The faster process becomes normal work.
This creates a strange measurement problem. The better the improvement is absorbed, the less visible it becomes.
You see the new output, but you stop seeing the avoided effort:
- the report nobody rebuilt from scratch;
- the error that never reached review;
- the context nobody had to search for;
- the explanation nobody had to repeat;
- the hand-off that no longer needed a meeting.
That is why asking “What did this automation save?” is too narrow. The return is spread across hundreds of small absences.
To measure it, you need a counterfactual. What would this work have taken using the old system? Track cycle time, review effort, error rates and throughput before the new baseline becomes invisible.
It is not a collection of tools. It is an engine.
The strongest returns do not come from a folder full of unrelated automations.
They come when improvements begin to work together.
A reporting workflow uses a shared context source. The context source is kept current by another process. A common evaluation checks the draft. Corrections from that evaluation improve the instruction used next time. The finished report becomes better context for the next decision.
Each part makes the others more useful.
Think of the central engine as five connected layers:
- Shared context: the facts, standards and examples the organisation wants reused.
- Reusable instructions: the best current way to perform recurring work.
- Workflows and automations: the movement of work between people, models and systems.
- Tests and evaluations: the checks that make quality repeatable.
- Organisational memory: the corrections and lessons fed back into the other four layers.
An isolated prompt might save six minutes. Added to this engine, it can also improve the workflow, strengthen the evaluation and give the next person a better starting point.
That is the shift from personal productivity to organisational capability.
What is actually compounding?
We should be precise here.
A single reusable automation produces a recurring return. That return accumulates, but it is not automatically exponential.
A steady stream of improvements produces an upward-curving cumulative return. Earlier improvements keep paying while newer improvements join them. When those improvements share context, tests and memory, they also reinforce one another.
The stronger form of compounding appears when some of the saving is reinvested.
A better review workflow frees time. Some of that time goes into better tests. Better tests reduce rework. Less rework creates room to document the next pattern. The team gets better at improving the system.
That is the flywheel:
- Improve the system.
- Recover time on every repeated use.
- Reinvest part of the recovered time.
- Make the next improvement easier or better.
- Repeat.
The return is not coming from AI alone. It comes from capturing what the team learns, connecting it to a shared system and making it reusable.
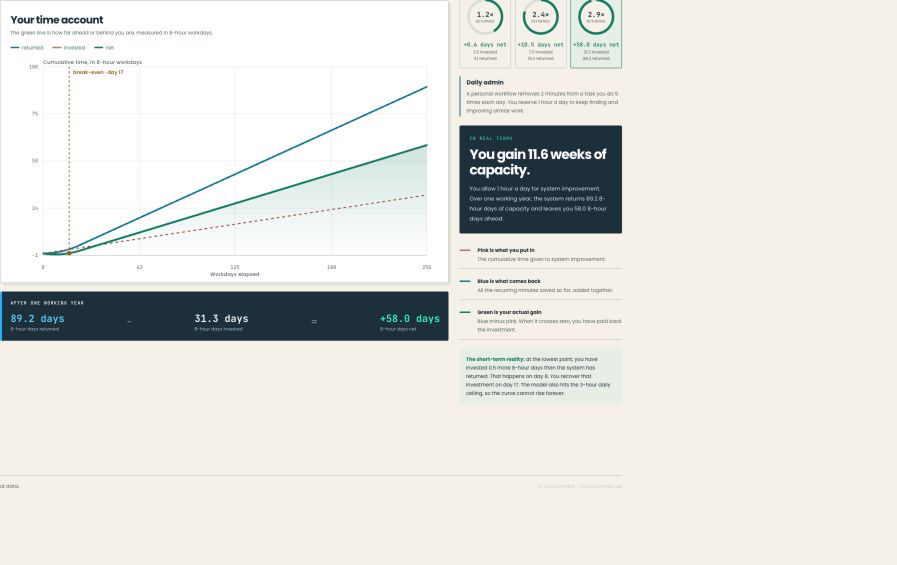
The green curve is the actual gain: all time returned, minus the time invested.
The model can also tell you when to stop
This is not an argument for giving everybody unlimited time to build automations.
Some automations are bad investments.
The weak example in the calculator takes 12 hours to build, runs only twice a day, works less than half the time and loses value quickly. After one working year, the programme has invested 31.3 days and returned only 5.9.
It is still 25.4 days behind.
That is useful information. The calculator is not there to prove that every AI idea is worthwhile. It is there to expose the assumptions that make an idea worthwhile.
The risk usually sits in one of six places:
- Low reuse. The workflow does not happen often enough.
- Low adoption. People do not trust or use what was built.
- Hidden effort. Testing, rollout, maintenance and review were ignored.
- Gross savings. The estimate forgets the time needed to check the output.
- Short lifespan. The process changes before the build pays back.
- A hard ceiling. There is only so much repeatable work available to remove.
This is why the calculator includes reality checks. The optimistic number is not the interesting one. The interesting number is the one that survives honest assumptions.
A better question for leaders
When somebody asks for an hour to improve an AI workflow, the question should not be:
Why are you spending an hour to save six minutes?
It should be:
Where do those six minutes recur, who inherits the saving, and when does the time account turn positive?
That changes the conversation.
You can ask for a small amount of evidence:
- What task or failure is being removed?
- How many times does it happen each week?
- What is the saving after review and rework?
- How many people will genuinely use the improvement?
- How long will it remain useful?
- What will we stop doing if it does not pay back?
These questions create discipline without killing experimentation.
Measure ROI at three levels
If you only measure each automation in isolation, you will miss the thing you are trying to build.
I would look at the return at three levels.
1. The improvement
How many hours did it take to build, test and roll out? How many net minutes does it remove each time? When does that specific investment pay back?
2. The team
How many people inherit the saving? Does it reduce cycle time, rework or waiting? Has the team created more capacity without adding headcount?
3. The system
Is the next improvement becoming quicker to make? Are teams reusing the same context, instructions, connectors and evaluations? Are corrections improving the shared engine rather than disappearing into a chat history?
The first level gives you a business case. The second shows operational value. The third tells you whether you are genuinely compounding.
This also protects against a common mistake. Time saved is not automatically money saved. It becomes economic value when the organisation converts that capacity into more output, better quality, faster service, lower risk or avoided hiring.
Keep a time-dividend ledger
The calculator is a model. The next step is to replace assumptions with observations.
For every meaningful improvement, record:
- build, test and rollout time;
- minutes removed from each use;
- actual uses each week;
- people who inherited it;
- adoption and failure rate;
- ongoing maintenance;
- the point at which it paid back;
- where the saving was reused or redeployed;
- and which shared parts made the next improvement easier.
Review the ledger after one month and again after three.
Kill the weak improvements. Standardise the strong ones. Share anything that solves a problem more than one person has.
Over time, you will learn which kinds of AI work compound inside your organisation and which merely create interesting demos. More importantly, you preserve a view of the return before it disappears into normal work.
The hour is not the cost. It is the principal.
The key thing is to stop treating all time spent on improvement as time lost to delivery.
Some of it will be lost. Some ideas will fail. That is why measurement matters.
But when a small improvement is used frequently, lasts long enough and spreads across a team, the original hour behaves less like a cost and more like principal. It funds a stream of future returns.
That is the case for compound engineering.
Not that every automation is valuable. More like this: small, reusable improvements can become far more valuable than they look on the day they are made.
Use the calculator. Put in your own numbers. Then watch the time account, not the activity.